 It’s not magic or a crystal ball. It is complex number-crunching using extensive neural networks.
Our research in stock price actions has led us to understand how to use AI, specifically Neural Networks, to predict the next-day movement (up or down) of every stock in the S&P 500.
We apply neural networks in a different way than others. We “nest” them together to increase the accuracy of our predictions. We start with the best data available for the past performance of the asset. We back-test (called training) for at least 18 months. Then, we process it through an initial neural network, but we route it back through several similar neural networks before completion. (This is called “nesting”.)
Finally, we take the information and test it forward for six months back from the present to confirm that the result is an accurate prediction. Only then do we accept it for use. Our minimum accepted probability of a successful prediction is 80%.
 Subscribers will receive access to a web page listing all of the daily predictions. The list is sort-able and searchable. Predicted individual asset price movements are shown by color: a gain in green and a loss in red. Also, the probability of accuracy is listed beside the color. It’s important to note that if a symbol’s probability is not higher than 80%, the symbol will have no prediction for that day.
It is essential to understand that while we compute the price action for each stock in the S&P 500, not all assets will generate a price-action prediction. Some are in a low-ranging condition, meaning they make many small moves up and down and statistically don’t have a direction. We show them with a badge as “no pred”. Here are the badges we use in the report.

Indicates that no prediction can be made. (There is insufficient statistical data for the neural networks to make a prediction.)

Indicates that the price-action will be up. (At some point during the next trading day, the price will be higher than at the time of prediction.)

Indicates that the price-action will be down. (At some point during the next trading day,
the stock price will be lower than at the time of prediction
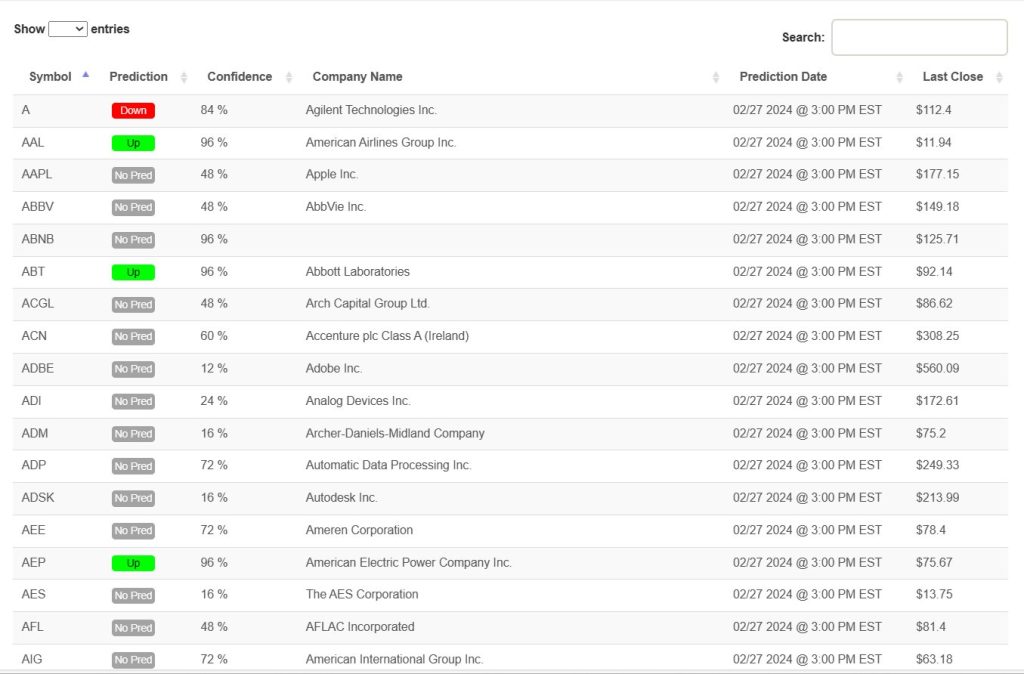 Each day, as a subscriber, you can access a non-public web page listing all S&P500 stock symbols and our predictions. The image below is a sample of what the page looks like.
Beside each prediction badge is the prediction confidence percentage. Remember that it is not presented as a prediction if we do not find at least 80% confidence. The badge at the extreme right side will take you to the listing of the trades performed using our “nested” neural networks to establish the confidence level and predict the direction of the price action.
Other explanations follow.
The “Prediction Date”, is the time that the neural networks generated the prediction for the next day’s stock value.
The “Last Close”, is the stock price at the time of the prediction.